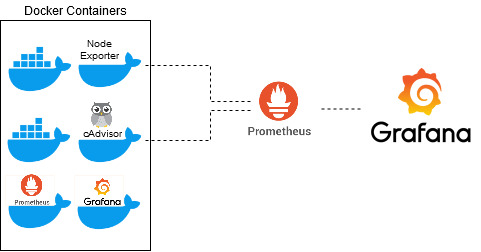
In this blog, we are implementing monitoring for Docker containers using Docker images. We will use the following open-source options for the monitoring task:
To keep things simple, we will provide all the necessary tools via docker and only make very few adjustments.
Enable cgroups limit support
First let’s see if docker stats provides us with all information.
On my Rasperry Pi 4 the MEM usage was 0.00% for every container on the docker stats --no-stream output.
CONTAINER ID        NAME                    CPU %               MEM USAGE / LIMIT     MEM %               NET I/O             BLOCK I/O           PIDS
234aaa99f2d0        gq-gmc-service_app_1    0.03%               0B / 0B               0.00%               5.32kB / 0B         10.5MB / 0B         1
Append cgroup_enable=cpuset cgroup_enable=memory cgroup_memory=1 in the /boot/cmdline.txt to enable cgroup memory option.
Additionally, the following lines should be added to /etc/docker/daemon.json.
{
  "exec-opts": ["native.cgroupdriver=systemd"]
}
If the file is not empty,these key, making sure that the resulting file is valid JSON. Be careful that every line ends with a comma (,) except for the last line.
Now Docker uses systemd as cgroupdriver.
After a reboot we can see the memory usage of the containers.
CONTAINER ID        NAME                    CPU %               MEM USAGE / LIMIT     MEM %               NET I/O             BLOCK I/O           PIDS
234aaa99f2d0        gq-gmc-service_app_1    0.02%               12.16MiB / 3.738GiB   0.32%               5.39kB / 0B         10.5MB / 0B         1
Docker container
Now we provide all necessary tools as a docker container using docker-compose.
Therefore we create the file docker-compose.yml with the following content:
docker-compose.yml
version: '3.7'
services:
  prometheus:
    image: prom/prometheus
    restart: always
    ports:
      - "9090:9090/tcp"
    networks:
      - front
    volumes:
      - ./prometheus.yml:/etc/prometheus/prometheus.yml:ro
      - prometheus_data:/data:rw
    command:
      - '--config.file=/etc/prometheus/prometheus.yml'
      - '--storage.tsdb.path=/data'
      - '--storage.tsdb.retention.time=30d'
      - '--web.console.libraries=/etc/prometheus/console_libraries'
      - '--web.console.templates=/etc/prometheus/consoles'
  exporter:
    image: prom/node-exporter
    restart: always
    volumes:
      - /proc:/host/proc:ro
      - /sys:/host/sys:ro
      - /:/rootfs:ro
    command:
      - '--path.procfs=/host/proc'
      - '--path.sysfs=/host/sys'
      - --collector.filesystem.ignored-mount-points
      - "^/(sys|proc|dev|host|etc|rootfs/var/lib/docker/containers|rootfs/var/lib/docker/overlay2|rootfs/run/docker/netns|rootfs/var/lib/docker/aufs)($$|/)"
    network_mode: host

  cadvisor:
    image: zcube/cadvisor
    restart: always
    privileged: true
    devices:
      - /dev/kmsg
    ports:
      - "8080:8080/tcp"
    command:
      - '--docker_only'
      - '--disable_metrics=disk,diskIO,tcp,udp,percpu,sched,process'
      - '--housekeeping_interval=10s'
    networks:
      front:
        aliases:
         - cadvisor
    volumes:
      - /:/rootfs:ro
      - /var/run:/var/run:ro
      - /sys:/sys:ro
      - /var/lib/docker/:/var/lib/docker:ro
      - /dev/disk/:/dev/disk:ro

    grafana:
        image: grafana/grafana
        ports:
          - "3000:3000/tcp"
        networks:
          - front
        volumes:
          - grafana_data:/var/lib/grafana
        environment:
          - GF_AUTH_ANONYMOUS_ENABLED=true

networks:
  front:
    driver: bridge

volumes:
  prometheus_data:
  grafana_data:
additionally we create a file prometheus.yml with the following content in the same folder as the docker-compose.yml:
prometheus.yml
scrape_configs:
  - job_name: 'containeradvisor'
    scrape_interval: 5s
    static_configs:
      - targets: ['X.X.X.X:8080']

  - job_name: 'node-exporter'
    scrape_interval: 5s
    static_configs:
      - targets: ['X.X.X.X:9100']
For the targets please enter your Docker host IP or DNS name.
Now we can start our containers with the following command docker-compose up -d.
Grafana
Now we can login to Grafana http://<DOCKERIP>:3000 with user User admin and the passwort admin.

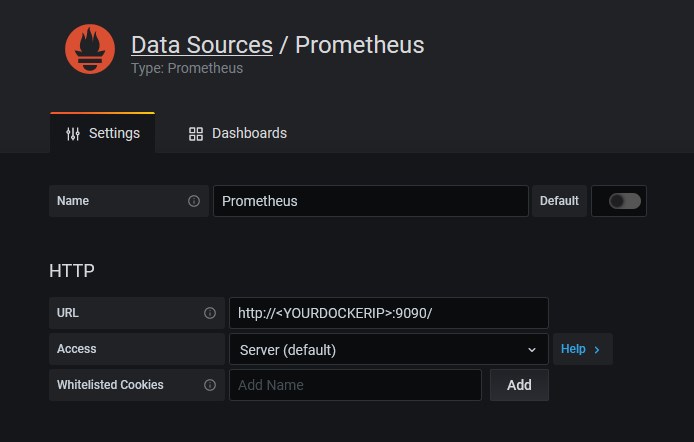
add data source Prometheus to Grafana. The URL ist the one of oure Prometheus container.
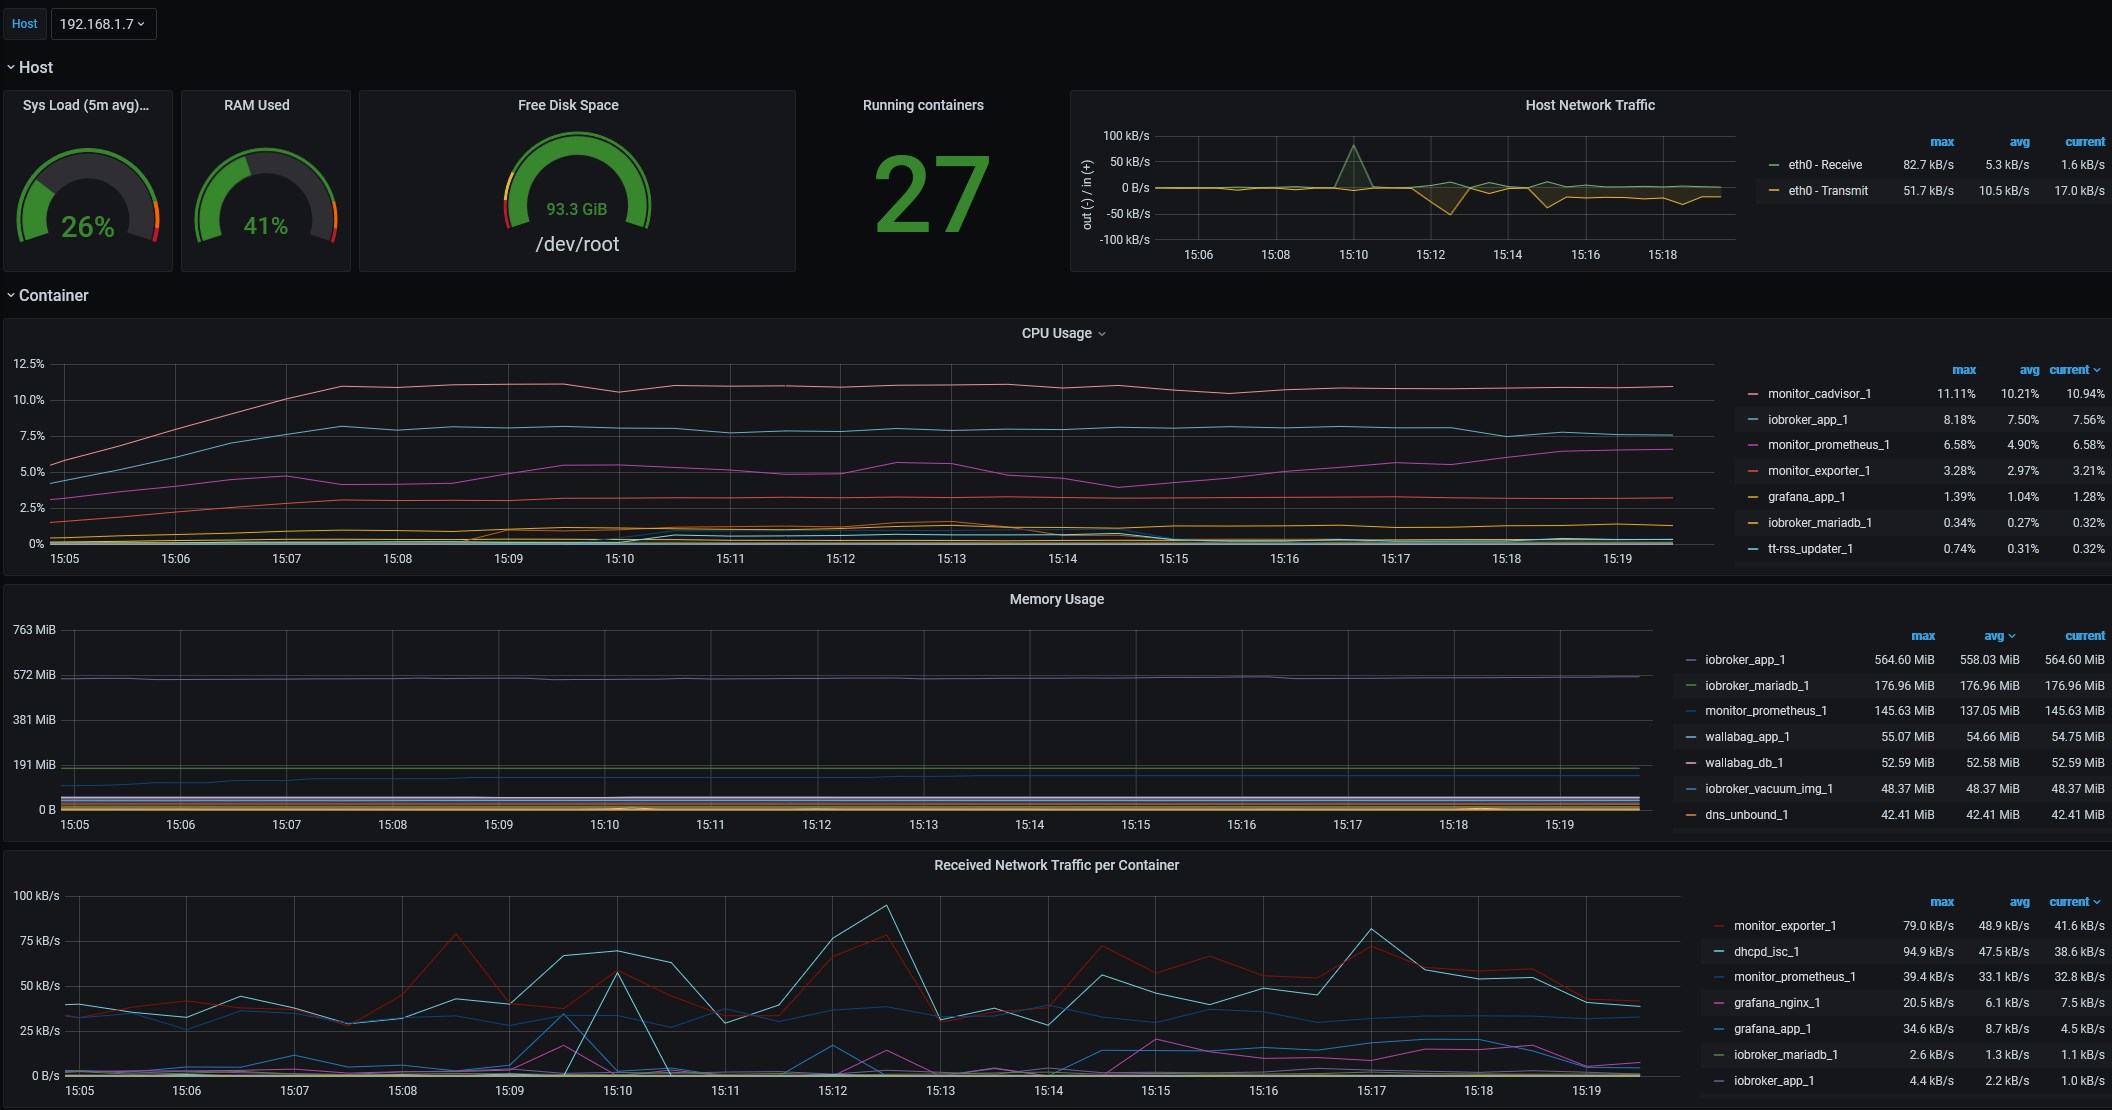
We can now import a dashboard, by entering the ID 12831 or any other ID of one of Grafana’s dashboards provided on the Grafana Dashboard side.
now we have a quick overview of our Docker system load.